Exploration
TangleGuard offers the capability to explore the source code as an interactive graph diagram.
It provides you with high level diagrams which reveals the system’s key building blocks and how they depend on one another. The rendering it done using Cytoscape.js and the Dagre layout.
Within the Designer you can browse those diagram and configure it as you need. Those diagrams are interactive. You can move nodes and layers around as you like. Soon your custom node and layer arrangement will be persisted. Right now TangleGuard recalculates the layout each time a diagram gets opened.
Package Overview
Section titled “Package Overview”When you first open the diagram, the depth level is set to 0. This means that only the highest level components get shown, which are the packages. You can see how the packages are connected to each other. The number in brackets is the line count of the package.
Below is an example of ripgrep.
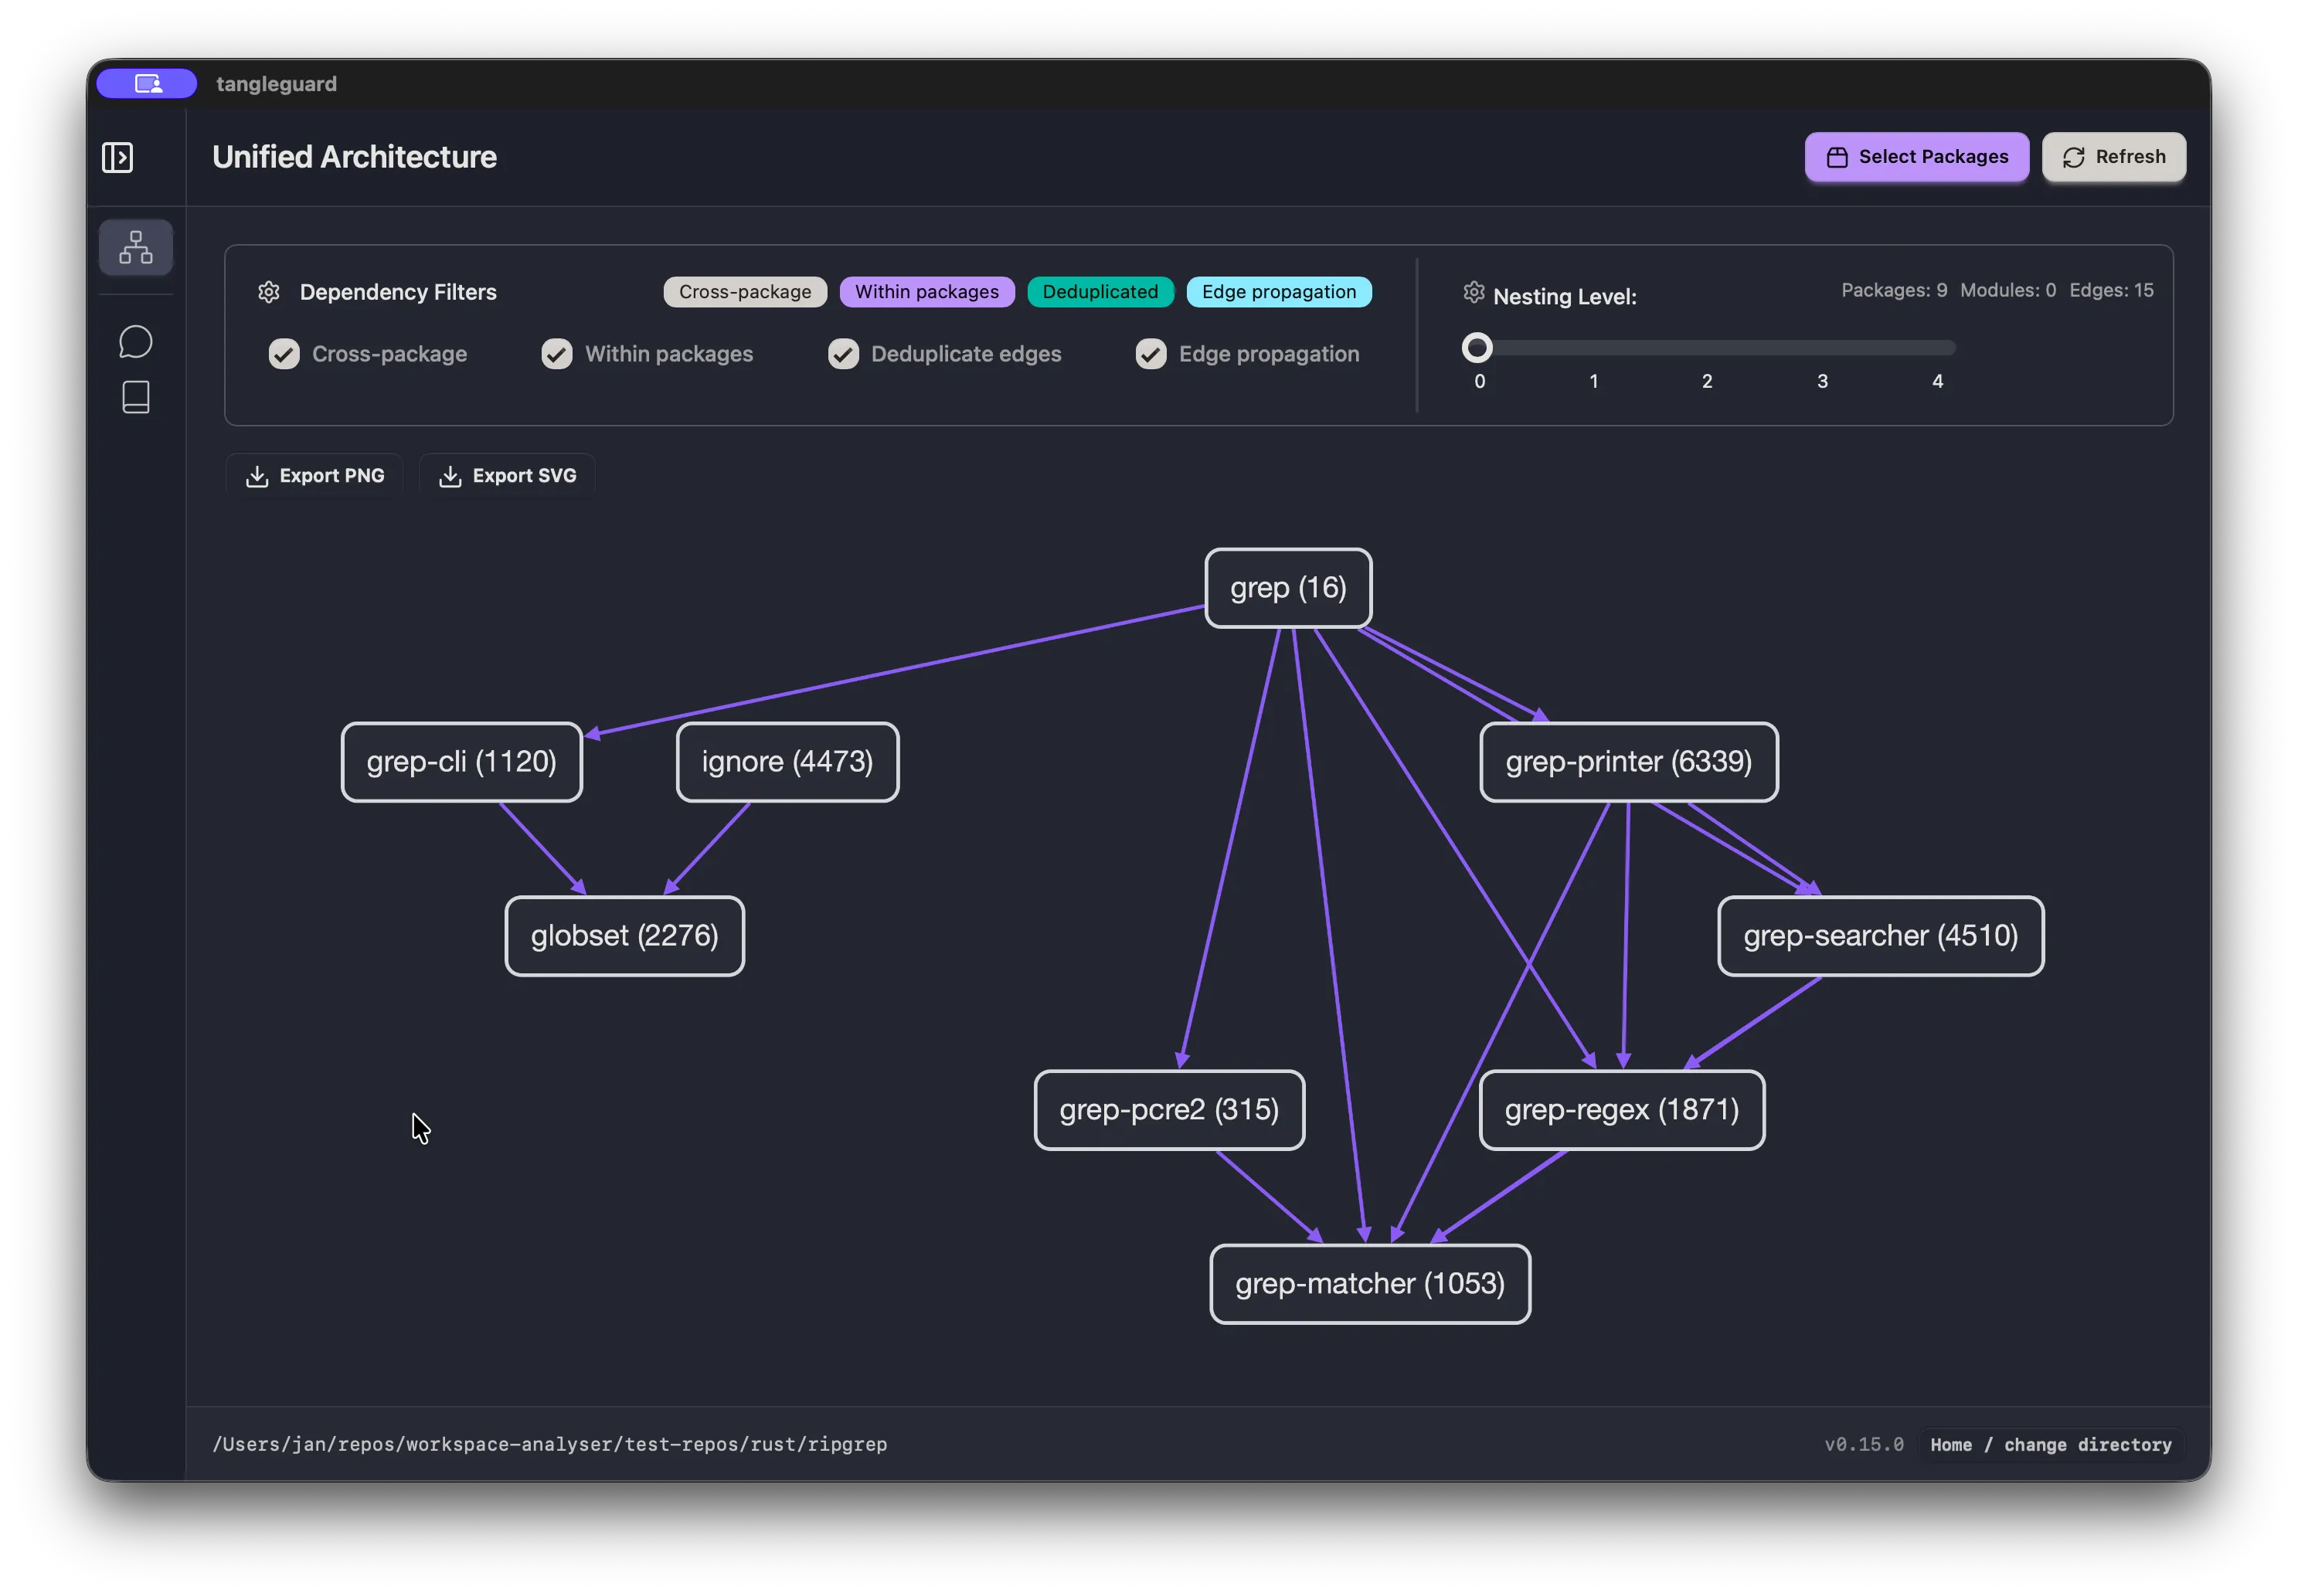
On the top right, you see a button which opens a model, where you can also select which packages you want to get displayed.
Module Overview
Section titled “Module Overview”If you select a depth level more then 0 by using the slider, all the top level modules will be shown in addition to the packages. You can go 4 levels deep. This might lead to a very large graph.
The edges are solid for a direct dependency, meaning those components are directly connected via an import statement. The edges are dashed for an indirect dependency, which means that the component has nested components which cause the dependencies to get propagated up to visible node.
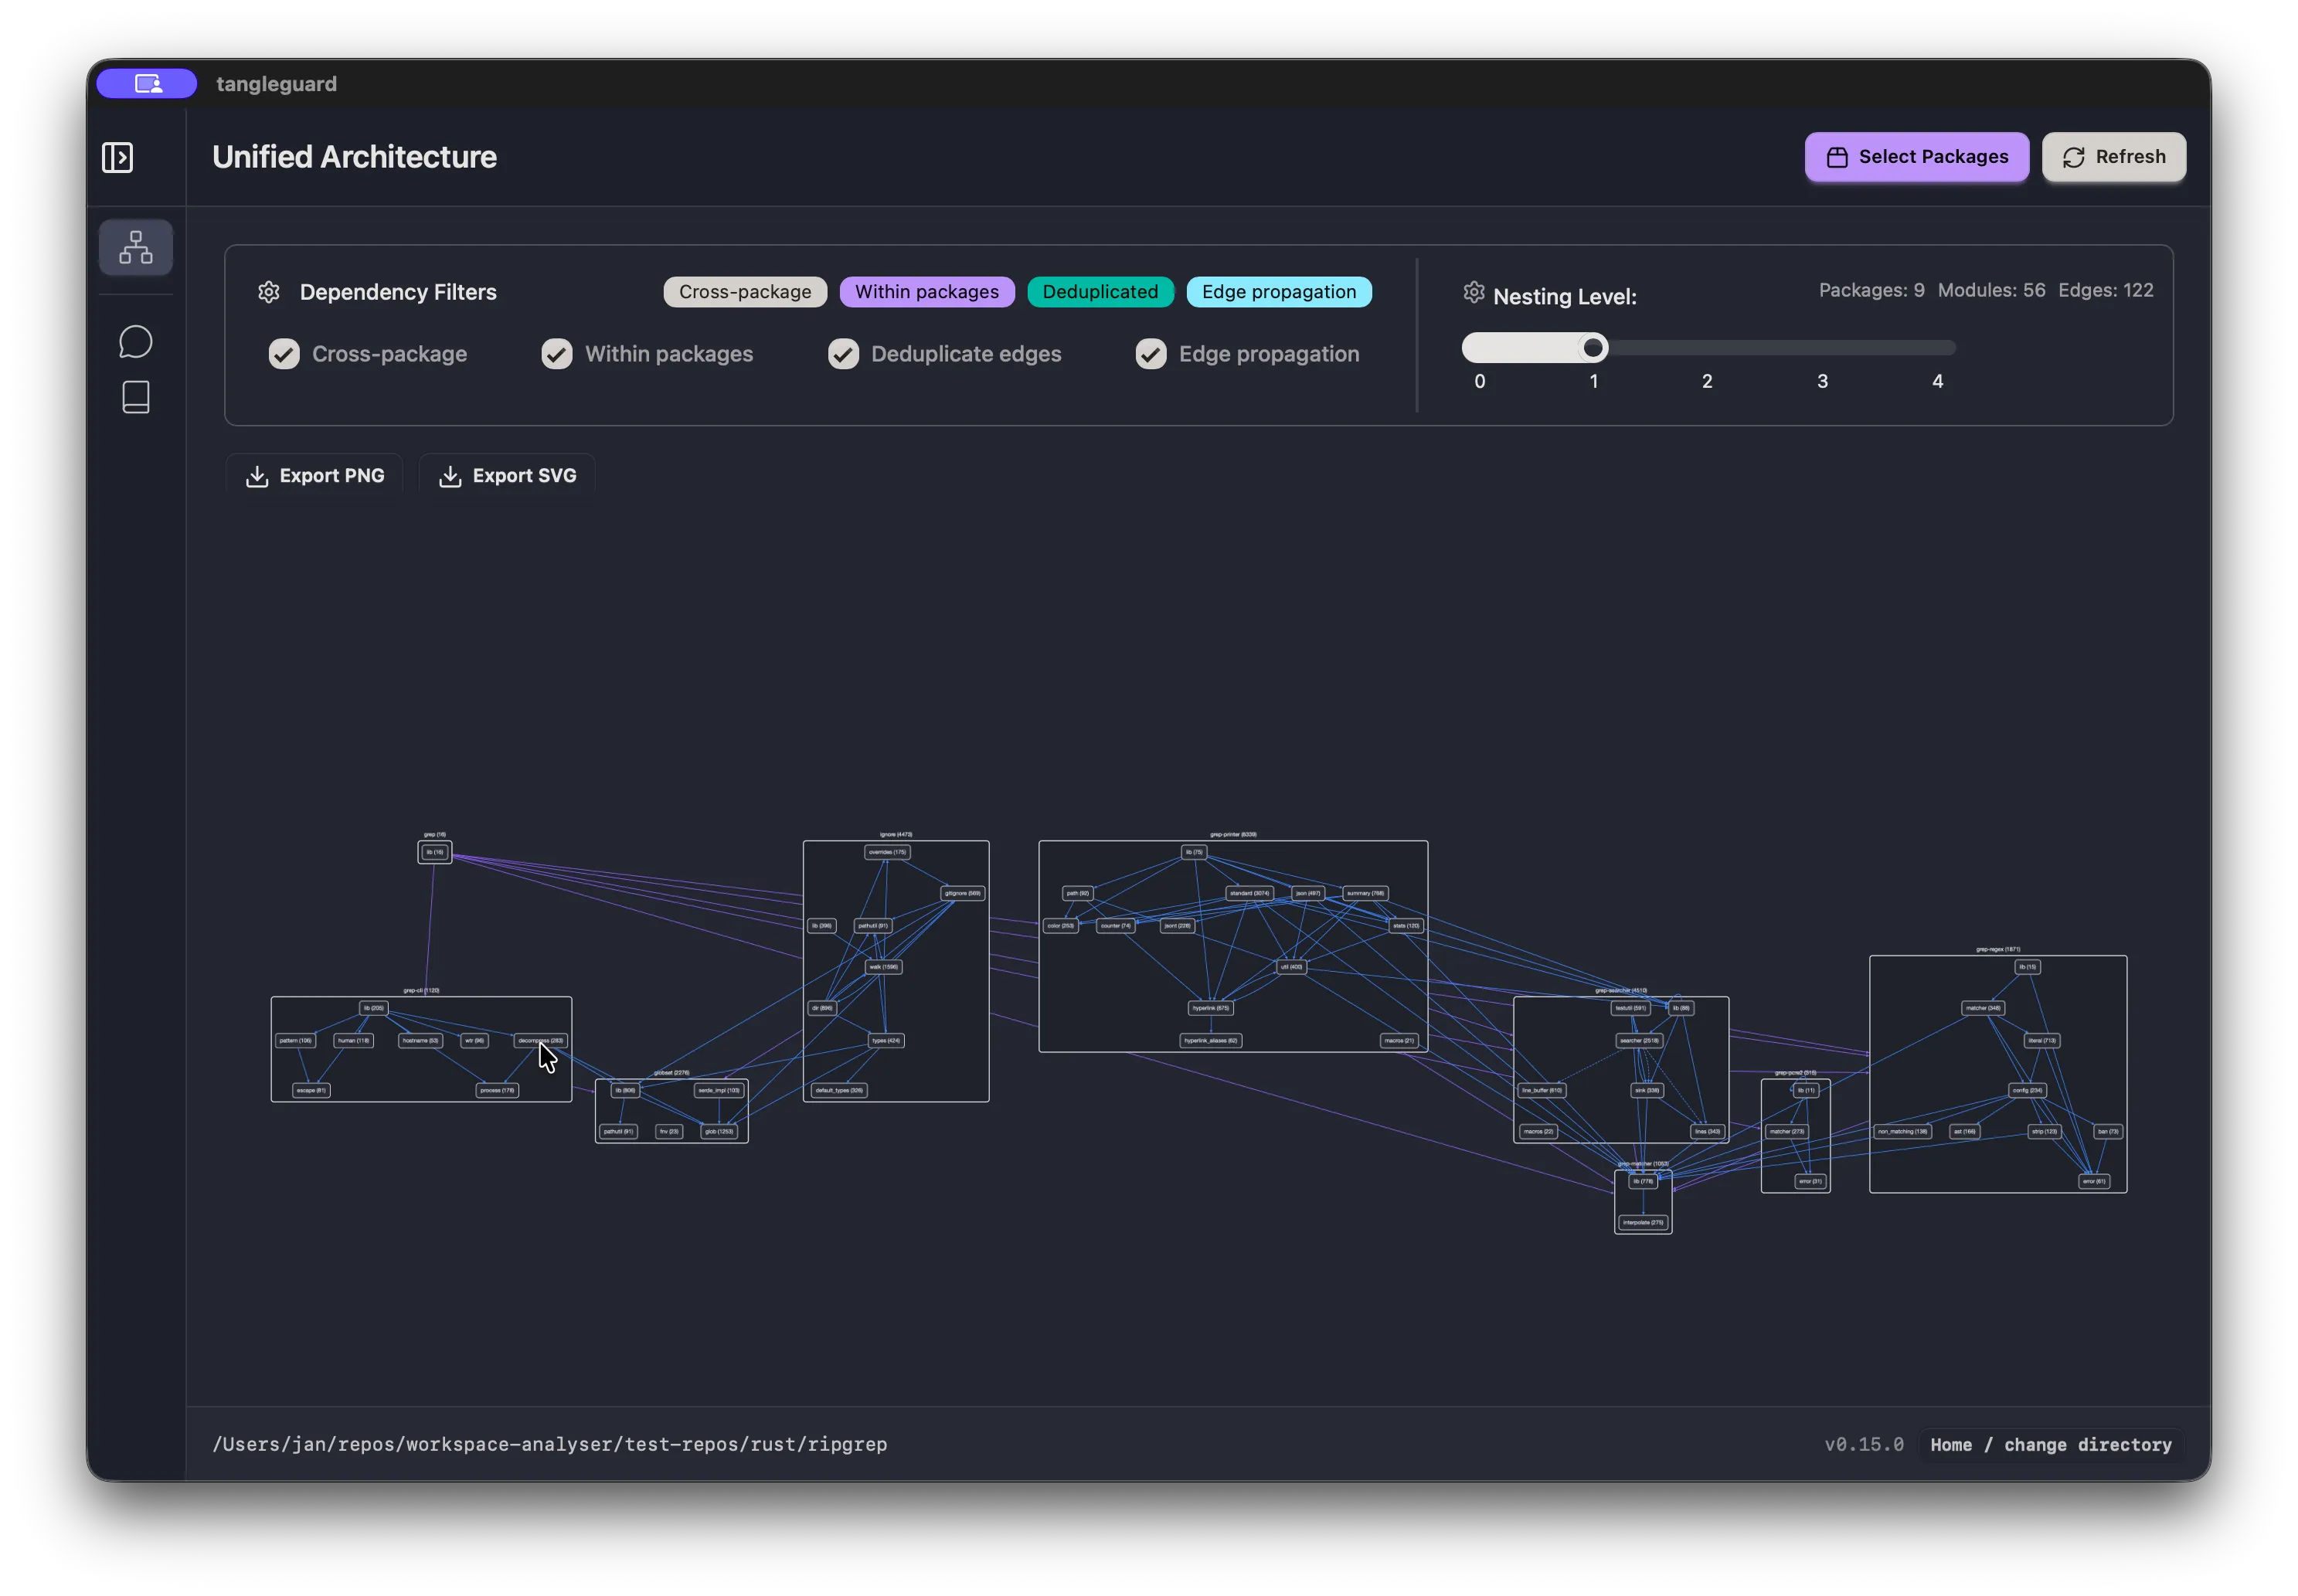
You can click on each edges to get the dependencies information displayed in a panel. In addition, you can configure the edges you want to get displayed, by using the dependency filter.
Evaluate the Structure
Section titled “Evaluate the Structure”When using TangleGuard you will see various graph diagrams which show the packages or modules of your application.
Each diagram represents a different view of your architecture, but the main focus is always the coupling and cohesion. With those you can make assumptions about the quality of your system regarding maintainability and flexibility.
- Try to identify how tightly or loosely coupled different parts of your system are.
- Look for patterns of high cohesion within modules — or the lack thereof.
- Diagrams showing high coupling may indicate areas where responsibilities are spread across too many components.
- Loose coupling and strong cohesion typically signal a more maintainable and modular design.
Understanding these diagrams is key to identifying architectural drift, erosion, and opportunities for improvement.
Easy to maintain
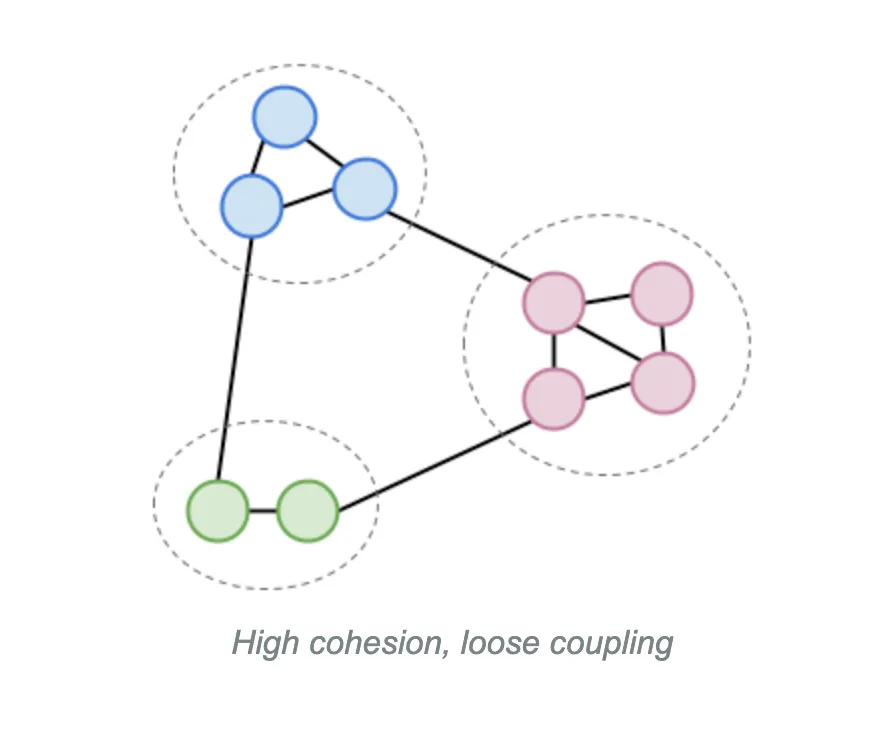
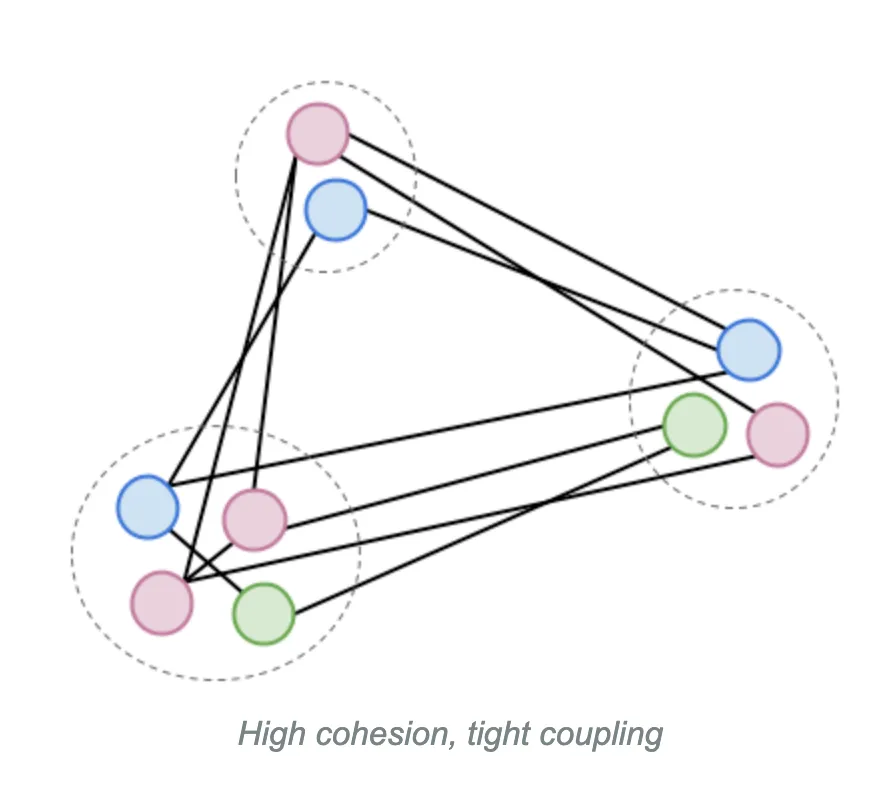
Section titled “Easy to maintain”Best you group your source code in a way that the components are cohesive and loosely coupled.
Below you see how this would look like [1].
You get such structure for example when applying domain driven design (DDD).
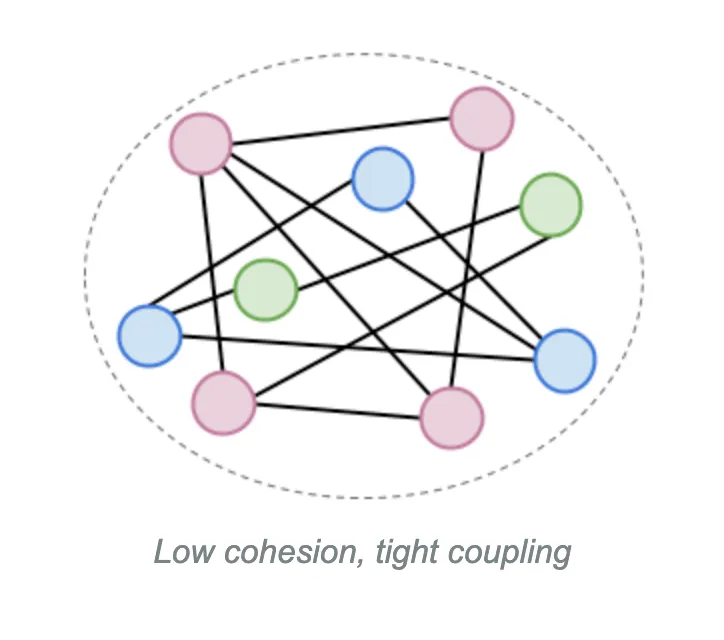
Harder to maintain
Section titled “Harder to maintain”A simple and common architectural style is the layered architecture as mentioned above.
If you don’t separate your code regarding feature or domain concerns, but rather regarding technical concerns, you will end up with a system which looks like the illustration below [1].
For each bug fix or feature you normally have to touch multiple components across the codebase which can easily lead to merge conflicts when working in a team.
Impossible to maintain
Section titled “Impossible to maintain”Below you see how an application can look like when you don’t separate at all [1].
You can what’s often referred to as a “spaghetti code” or “god object”.
This is very difficult to understand and hence maintain and proper isolated tests are very hard to write.
Examples
Section titled “Examples”Here you see some visualization examples of open-source projects.
For each project you’ll first see the an overview of the Cargo workspace. Each node represents a package from the repository.
For some repositories you’ll find examples component diagrams of specific packages. There, each node represents a module.
ripgrep
Section titled “ripgrep”https://github.com/BurntSushi/ripgrep
Packages
Section titled “Packages”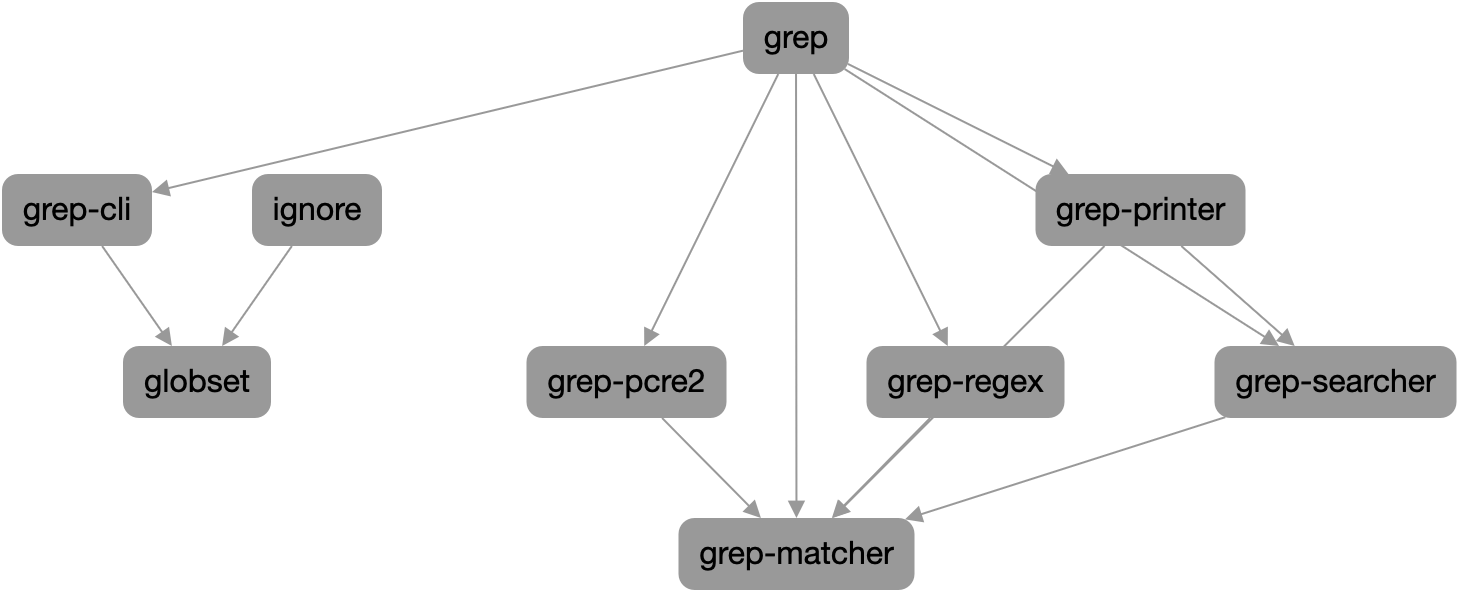
grep-cli
Section titled “grep-cli”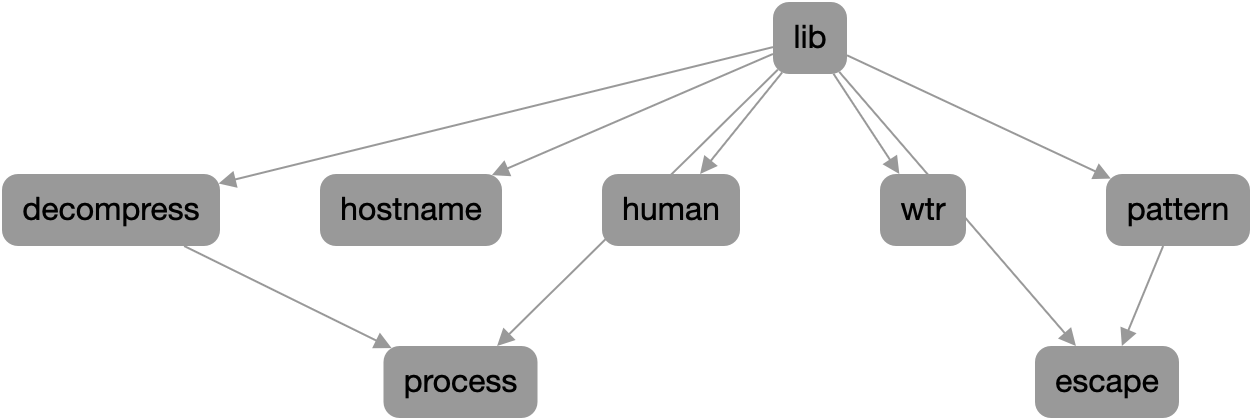
grep-printer
Section titled “grep-printer”
Spacedrive
Section titled “Spacedrive”https://github.com/spacedriveapp/spacedrive
Packages
Section titled “Packages”

https://github.com/astral-sh/ruff
Packages
Section titled “Packages”
ruff_formatter
Section titled “ruff_formatter”
ruff_python_formatter
Section titled “ruff_python_formatter”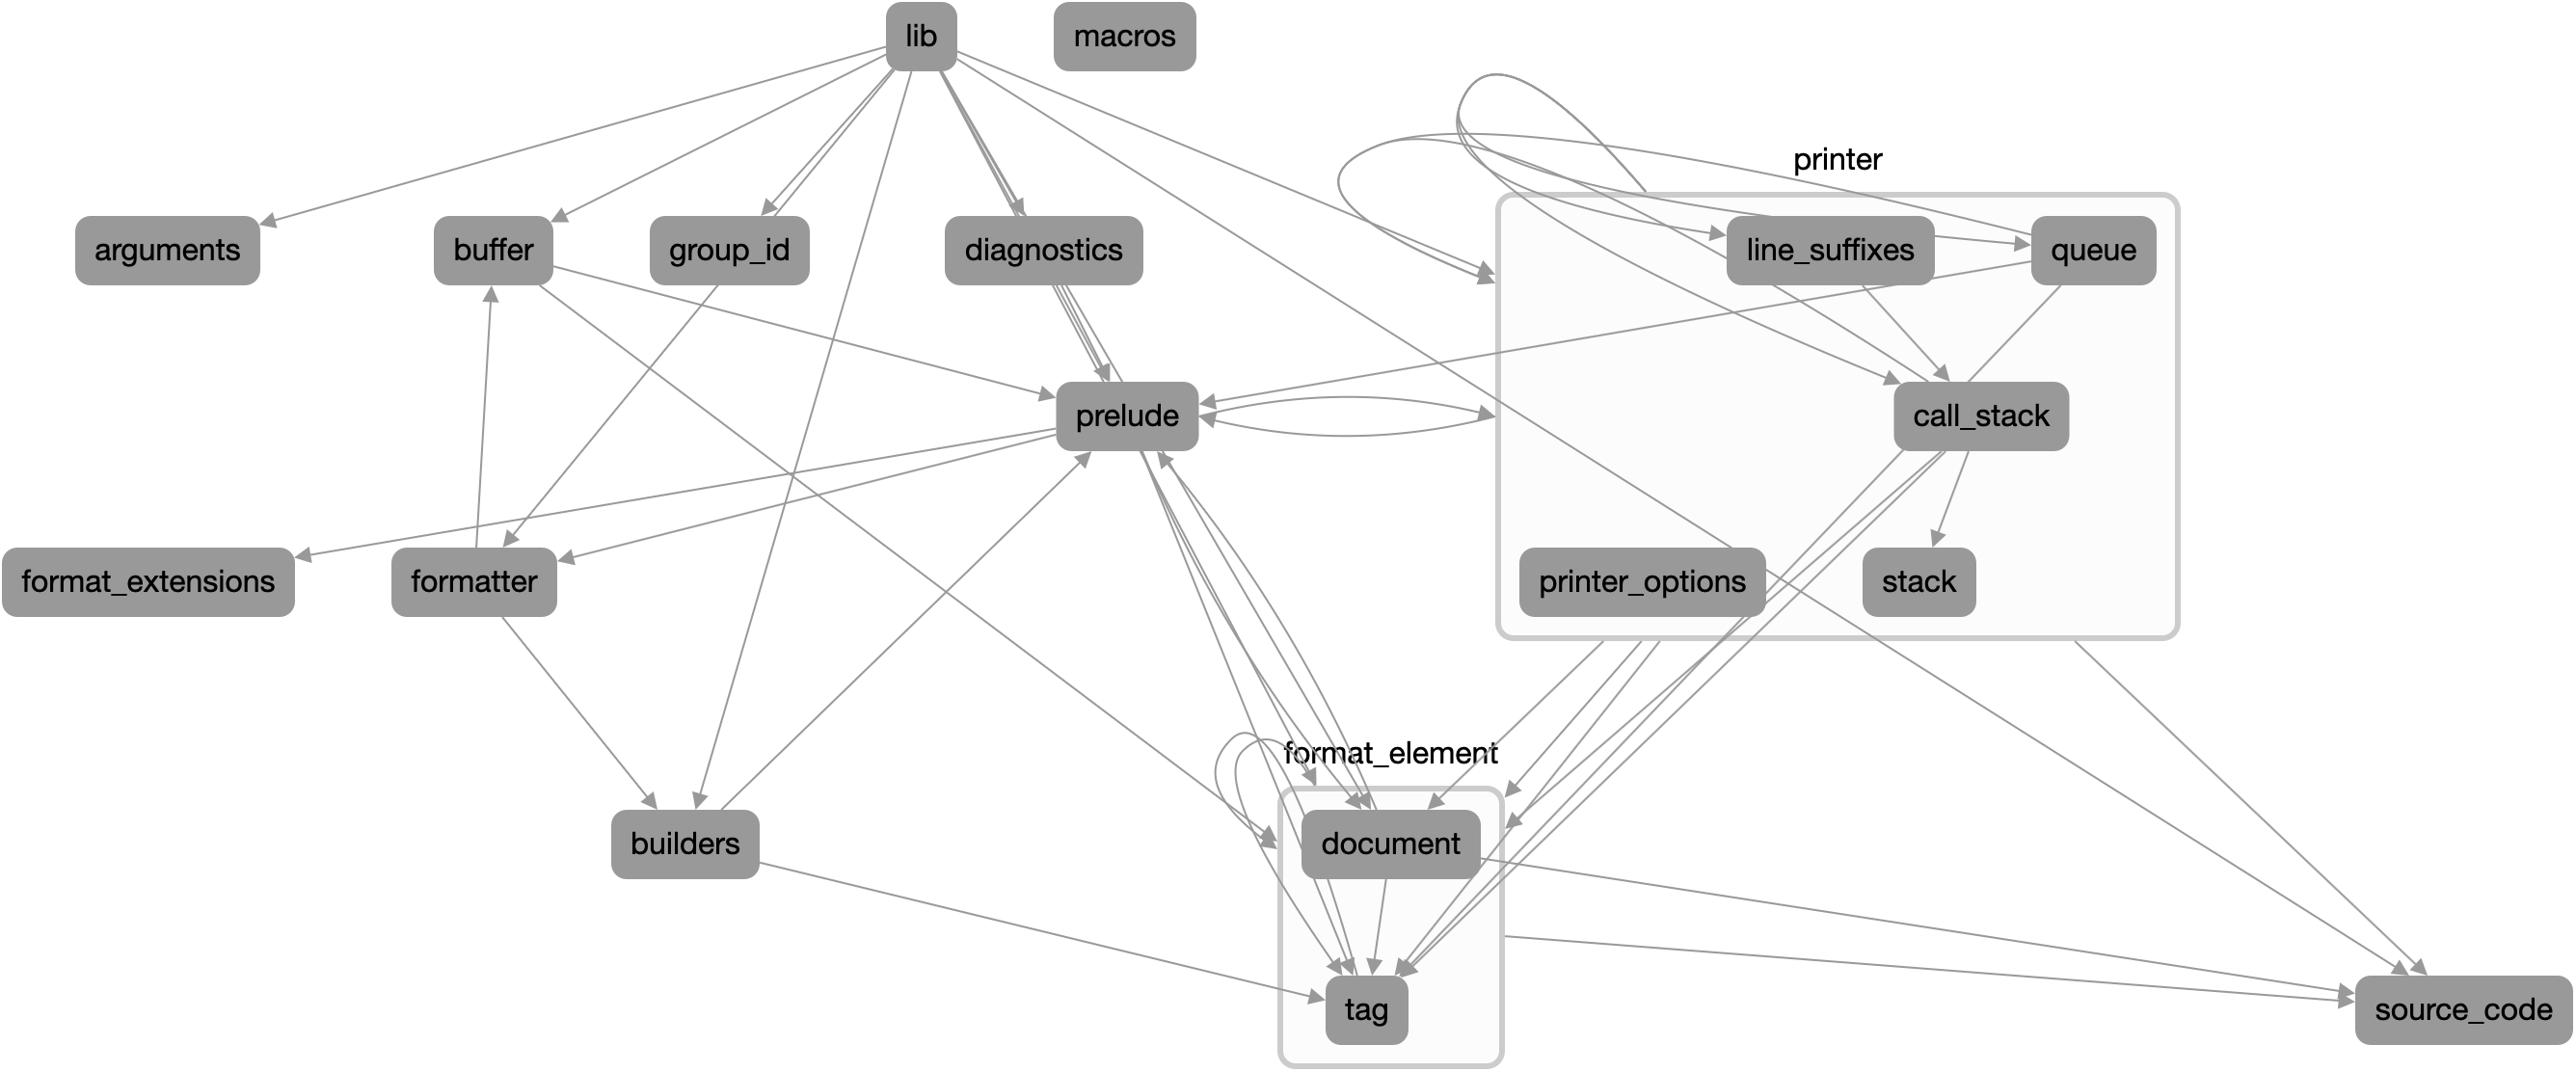
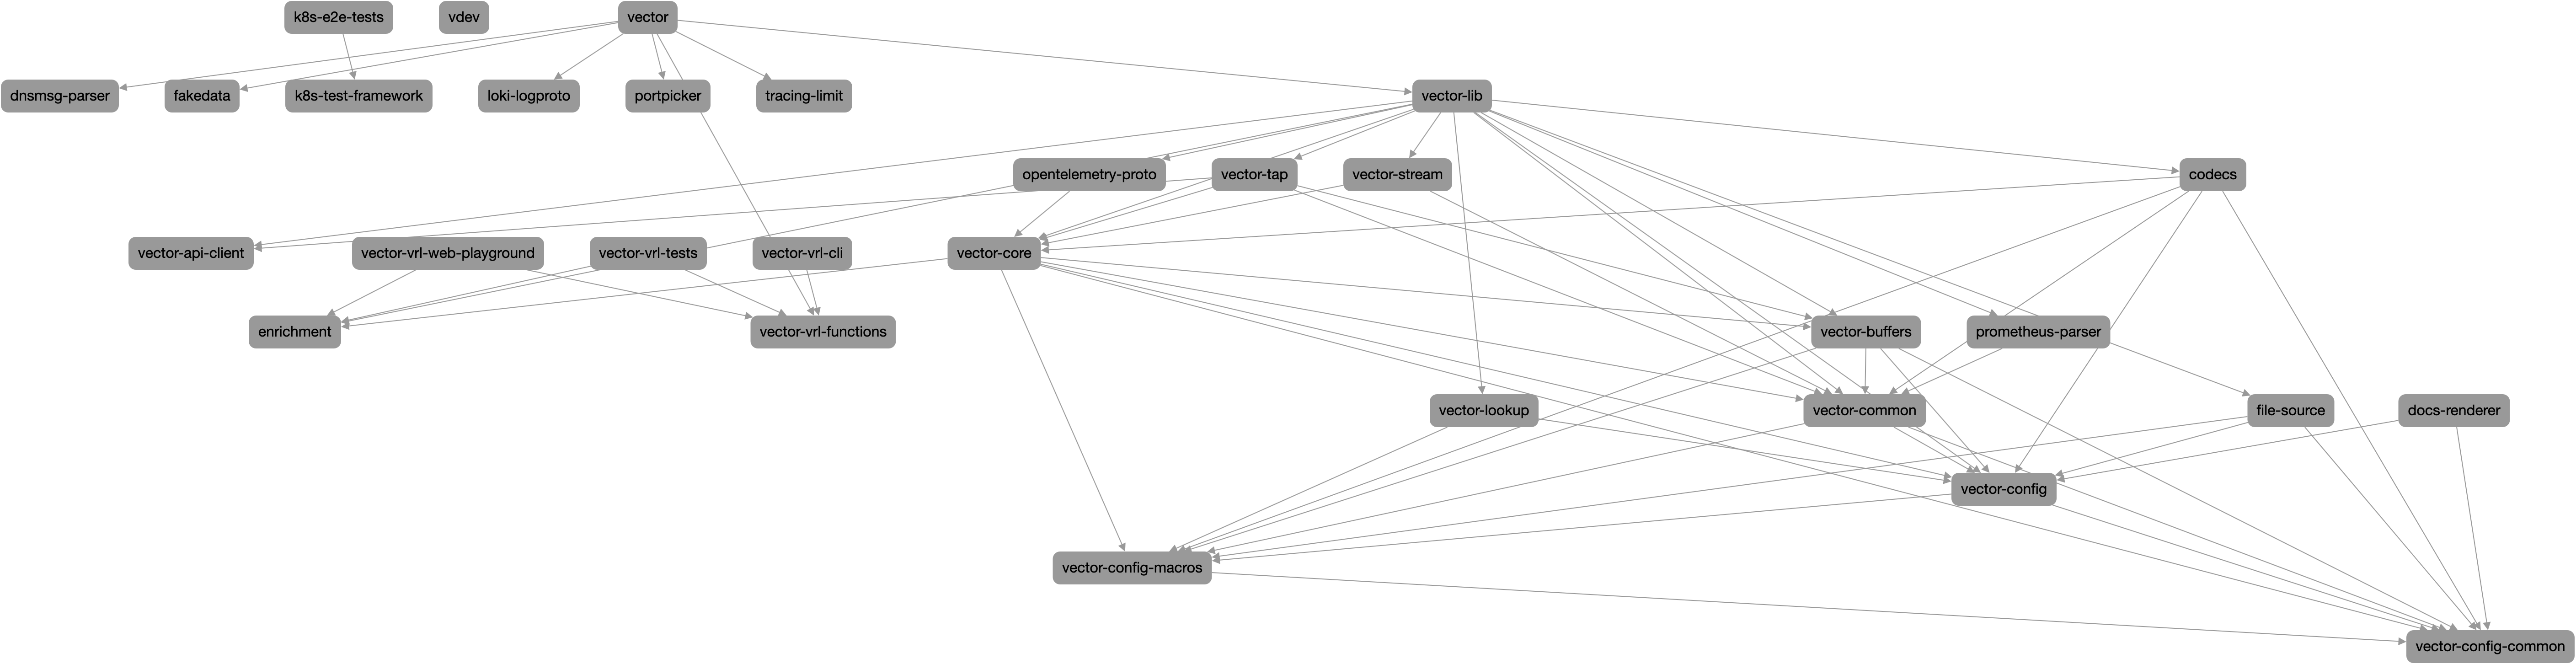
Vector
Section titled “Vector”https://github.com/vectordotdev/vector
Packages
Section titled “Packages”